EFFECT OF DENSITY SEPARATION SOLUTION ON ISOLATION OF MICROPLASTICS FROM SEA TURTLE NESTING BEACH SAND IN MAHARASHTRA AND GOA, INDIA
ADITI RENAKE# & ANDREA D. PHILLOTT
FLAME University, Pune, India
#aditirenake15@gmail.com
Download article as PDF
Introduction
Microplastic pollution has emerged as a pervasive environmental issue affecting marine ecosystems worldwide (Thompson et al., 2004). Defined as plastic particles smaller than 5mm, microplastics are commonly classified into two major categories based on their origin: primary and secondary microplastics. Primary microplastics are intentionally manufactured in microscopic sizes, for use in industrial and commercial applications (Cole et al., 2011). These include industrial resin pellets or nurdles, cosmetic microbeads used in personal care products, synthetic textile fibres, and abrasive particles used in cleaning process (Andrady, 2011; Browne et al., 2011). Secondary microplastics originate from the fragmentation and degradation of larger plastic debris already present in the environment. Common sources of secondary microplastics include discarded plastic bottles, fishing nets, packaging materials, plastic bags, and other consumer products that progressively breakdown into smaller fragments over time (Andrady, 2011) through physical, chemical, and biological weathering processes such as UV radiation, wave abrasion, mechanical friction, and thermal degradation (Thompson et al., 2004; Wright et al., 2013). Secondary microplastics are often irregular in shape and include fragments, films, foams, and degraded fibres, reflecting the characteristics of their source material (Cole et al., 2011).
Both primary and secondary microplastics are persistent, light weight, buoyant, and small in size, enabling their extensive dispersal across coastal environments, particularly sandy beach sediments that function as important habitats for various marine organisms (Browne et al., 2011; Wright et al., 2013). These organisms include sea turtles, which use beach habitats for incubation of eggs to produce hatchlings. Microplastics in beach substrates may change physical, chemical, and/or thermal properties of the nest substrate (Estrella-Jordan et al., 2023; Fuentes et al., 2023) and, therefore, influence nest microclimate, embryo development and survival, and hatchling sex ratios (given that the taxa demonstrate temperature-dependent sex determination). Hence, quantifying beach substrate microplastics and understanding the potential impacts is especially important, given ongoing concerns about the potential feminisation of sea turtle populations (Laloë et al., 2024) and increased embryo (Santidrián Tomillo et al., 2012; Hays et al., 2017; Mollet Saint Benoit, 2019) and hatchling mortality (Laloë et al., 2017; Hays et al., 2021) with climate change. Understanding the likelihood and contribution of environmental pathways of microplastic accumulation in the sea turtle egg (Savoca et al., 2018; Curl et al., 2024) is required to assess the contribution of beach plastics to embryo exposure to particles and plastic-associated chemicals that may affect organ development, metabolism, immunity (Zhang et al., 2021; 2024), sex determination, embryo development, and adult fertility, with potential long-term implications for population viability (Savoca et al., 2018). Quantifying beach microplastics and understanding the impacts is also required to inform plans, policy, and legislation to manage current plastics loads and minimise the entry of additional plastics into the environment (e.g., Dijkstra et al., 2021; Kumar et al., 2021; Willis et al., 2022).
Reliable detection and quantification of microplastics in beach sediments are, therefore, essential for understanding the extent of contamination and its ecological implications. Several methodologies have been developed for microplastic isolation from sediments, commonly involving sequential steps such as drying, sieving, density separation, organic matter digestion, filtration, and polymer identification (Hidalgo-Ruz et al., 2012; Prata et al., 2019). Density separation using a salt solution is one of the most widely applied techniques for isolating microplastics from sediments, as most plastic polymers possess lower densities than mineral particles in sediments, allowing plastics to float while heavier sediment grains settle (Claessens et al., 2011; Hidalgo-Ruz et al., 2012; Masura et al., 2015). Following density separation, the supernatant containing suspended microplastics typically undergoes vacuum filtration using fine filter membranes or glass fibre filters to retain the particles for further analysis. The filtered particles are visually inspected under a stereomicroscope or dissecting microscope, and suspected microplastics are identified and categorised based on their physical characteristics such as shape, colour, size, and texture (Nuelle et al., 2014; Masura et al., 2015). Visual inspection is an important preliminary step in microplastic analysis, as it enables synthetic particles to be distinguished from natural materials prior to polymer identification techniques such as Fourier Transform Infrared Spectroscopy (FTIR) or Raman spectroscopy (Hidalgo-Ruz et al., 2012).
A variety of salt solutions have been used to separate microplastics from sediments, including sodium chloride (NaCl), zinc chloride (ZnCl₂), potassium carbonate (K₂CO₃), sodium iodide (NaI), sodium bromide (NaBr), and sodium hexametaphosphate (SHMP). Each solution differs in density, cost, and isolation efficiency (Imhof et al., 2012; Claessens et al., 2013; Patti et al., 2020). Lower-density solutions such as NaCl (~1.2g/cm³) are inexpensive, non-toxic, and widely available, but may have less efficiency at isolating denser polymers such as polyethylene terephthalate (PET) and polyvinyl chloride (PVC) (Claessens et al., 2011; Masura et al., 2015). In contrast, high-density solutions such as ZnCl₂, NaI, and NaBr can isolate a broader range of polymers more efficiently, although they are relatively more expensive and may involve greater handling, disposal, environmental, and safety concerns (Coppock et al., 2017; Schütze et al., 2022). Recently, K₂CO₃ has gained attention as a comparatively high-density and less hazardous alternative; however, its performance relative to other commonly used salts still requires further evaluation under field-relevant conditions (Gohla et al., 2021).
As isolation efficiency is strongly influenced by the type and density of the salt solution used during extraction (Nuelle et al., 2014; Coppock et al., 2017), and different salt solutions can selectively recover different polymer types and particle sizes, recent studies comparing the efficiency of different salt solutions for microplastic isolation have highlighted the importance of selecting a solution based on sediment characteristics and target polymer types. Schütze et al. (2022) demonstrated that increasing solution density generally resulted in higher recovery rates of both conventional and biodegradable microplastics from solid matrices such as sand and soils. Sodium bromide (NaBr; density ~1.53g/cm³) showed particularly high recovery efficiencies for a wide range of polymers compared with lower-density solutions such as NaCl (density ~1.20g/cm³) and water (density ~1.0g/cm³) (Schütze et al., 2022). Similarly, NaI (density ~1.80g/cm³)-based density separation has achieved recovery efficiencies exceeding 95% for microplastics from complex sediment matrices (Karami et al., 2017). These findings indicate that differences in isolation solution can substantially influence microplastic recovery, thereby affecting estimates of microplastic abundance, composition, and morphology as well as comparability among studies,
Other factors may also be a consideration when selecting a salt solution for microplastic isolation. For example, NaBr and NaI provide high recovery efficiencies for microplastic isolation but are not commonly used due to the cost, handling requirements, and greater environmental and laboratory safety concerns in comparison to other salt solutions (Karami et al., 2017; Quinn et al., 2017). SHMP is rarely used as standalone isolation solution because it acts mainly as a dispersing agent rather than as a density separation solution (Masura et al., 2015).
In advance of work examining microplastics at sea turtle nesting sites in the states of Maharashtra and Goa, India, we compared the microplastic isolation efficiency of three density separation solutions – K2CO3, ZnCl2, and NaCl – for isolating microplastics from surface sand collected from four sea turtle nesting beaches. K2CO3, ZnCl2, and NaCl were selected for comparison as these solutions are among the most widely used in studies worldwide because of their density, cost, isolation efficiency, and low environmental toxicity (Claessens at al., 2011; Imhof et al., 2012; Coppock et al., 2017; Patti et al., 2020). By evaluating variations in microplastic recovery using different salt solutions, this study aims to determine the most efficient density separation solution for isolating microplastics from the beach sediments of the selected study sites and demonstrate good research practice in microplastics research.
Methods
Study Sites
The study sites encompass four sea turtle nesting beaches (Figure 1). Velas and Wayangani beaches are located in the state of Maharashtra, and Morjim and Agonda beaches are in Goa, India.
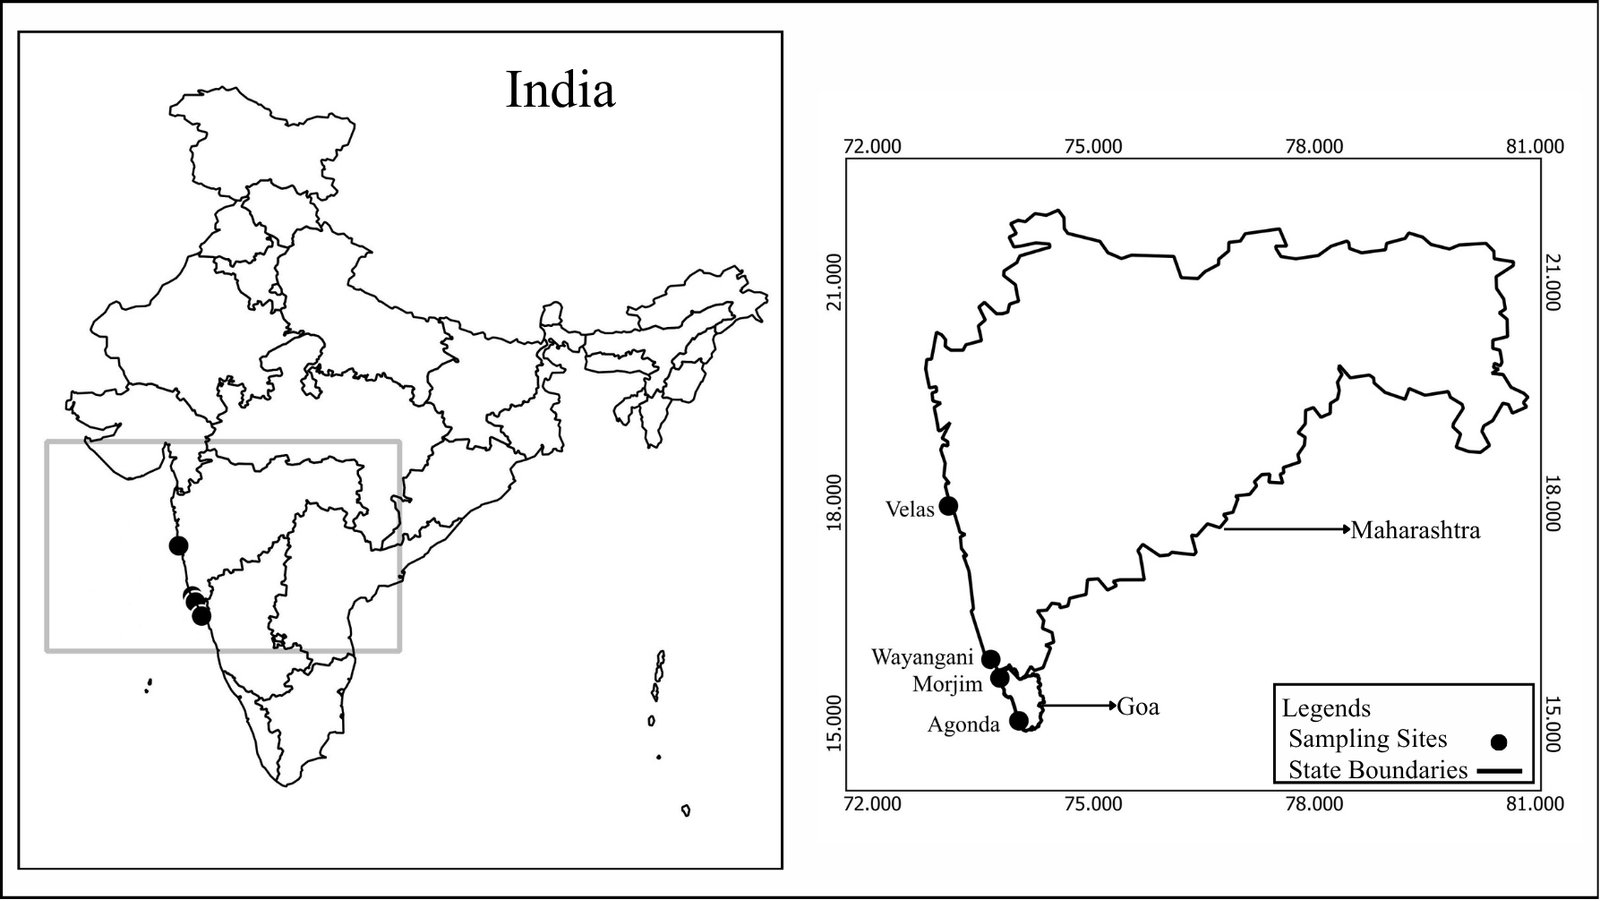 Figure 1. Sea Turtle Nesting Beaches from Which Sand Was Collected to Compare Microplastic Isolation Efficiency Using Different Salt Solutions.
Contamination Control
Several precautionary measures were implemented throughout field sampling and laboratory processing to minimise the risk of plastic contamination (Monteiro et al., 2020; Patti et al., 2020). During field sampling, sediments were collected using a metal trowel and transferred into pre-labelled paper bags to avoid contact with plastic materials. All clothing (including laboratory coats composed of 100% cotton) and accessories (e.g., hair ties) worn by researchers during field and laboratory work were plastic-free. Latex gloves were used while handling chemicals.
Non-plastic equipment and materials were used in the laboratory, including glass stirring rods, glass storage containers, and metal utensils. All equipment and laboratory utensils were rinsed three times with distilled water prior to use and dried using paper or cotton towels. Laboratory surfaces and instruments, including weighing balances and microscopes, were cleaned with ethanol before use, and ovens were thoroughly cleaned before drying procedures.
To monitor airborne contamination in the laboratory, three procedural control samples consisting of damp Whatman GF/B filter papers (1.2μm) placed in open petri dishes were exposed to laboratory air during sample preparation and analysis. In addition, all salt solutions used for density separation (K₂CO₃, NaCl, and ZnCl₂) were examined for microplastics by pre-filtering before use. Materials and equipment, including beakers, flasks, filters containing extracted material, and decanted solutions, were covered with aluminium foil throughout processing to minimise the risk of airborne particle contamination.
Sample Preparation
Sampling at each study site occurred in January 2026. Surface sand samples were collected to a maximum depth of 2cm using a metal garden trowel, and ~1kg of sediment at each location was collected into paper bags. Following collection, the samples were transported to FLAME University, Pune, Maharashtra, and stored at ambient temperature until processing.
For laboratory analysis, sand samples collected from each study site were homogenised separately in pre-cleaned glass trays using the coning and quartering method to ensure representative subsampling and to minimise sample heterogeneity (Campos & Campos, 2017). The sand was thoroughly mixed, then triplicate subsamples of 20g were placed in glass petri dish and oven dried at 50°C for 24hr to remove moisture prior to microplastic isolation.
Density Separation Protocol
Solutions for each salt were prepared using distilled water to concentrations in Figure 2 and stored in clean glass containers. The three subsamples of dried sand from each study sites were thoroughly mixed with each salt solution, by hand with a glass stirrer, in a 1L glass beaker then allowed to stand undisturbed at room temperature (Figure 2). Methods followed those outlined for previous studies on microplastic separation from sand using a solution of K₂CO₃ (Patti et al., 2020; Gohla et al., 2021), ZnCl₂ (Imhof et al., 2012), and NaCl (Thompson et al., 2004; Claessens et al., 2011; Balasubramanium & Phillott, 2016).
Microplastic Isolation
The floating fraction (supernatant) from each beaker containing the sand–salt suspension was carefully decanted into a glass Büchner funnel fitted with Whatman glass fibre filter paper (pore size 1.2µm). Vacuum filtration was subsequently carried out using a glass Büchner funnel assembly connected to a side-arm vacuum flask and an oil-free diaphragm vacuum pump under controlled vacuum pressure (≤700mm Hg) for the recovery of microplastics from sediment samples (Hidalgo-Ruz et al., 2012; Masura et al., 2015).
The filtration process typically required ~2–5 minutes per sample. Sides of the beaker were rinsed with distilled water into the filter to ensure complete transfer and recovery of any microplastic particles that may have adhered to the beaker surface (Masura et al., 2015; Miller et al., 2017). Filters were then rinsed with distilled water to remove residual salts and stored individually in glass petri dish to dry at room temperature prior to further analysis (Claessens et al., 2013; Masura et al., 2015).
Dried filter papers were examined for the presence of microplastics using a dissecting microscope at 10× magnification. Filter papers were systematically scanned to ensure complete coverage, guided by grid paper attached to the underside of the petri dish. Microplastics were retrieved using clean forceps under microscopic observation; a hot needle test (Beckingham et al., 2023) was performed on suspected particles that did not visually resemble microplastics for confirmation of their composition. Microplastics were transferred to a glass petri dish with labelled grid paper affixed beneath to aid spatial referencing. To maintain consistent orientation during observation and counting, the top and bottom of the grid paper were marked in different colours. Microplastics isolated from each sample were counted and categorised by shape (fibre, pellet, fragment, foam, film) according to Duncan et al. (2019).
The distribution of microplastic counts isolated using each salt solution at each location was assessed using a Shapiro-Wilk normality test, which indicated that the data were not normally distributed (p<0.05). Therefore, a permutational multivariate analysis of variance (PERMANOVA) was conducted to compare the number of microplastics isolated at each location using different salt solutions. The PERMANOVA (comprising 999 permutations) was conducted in PAST 4.03.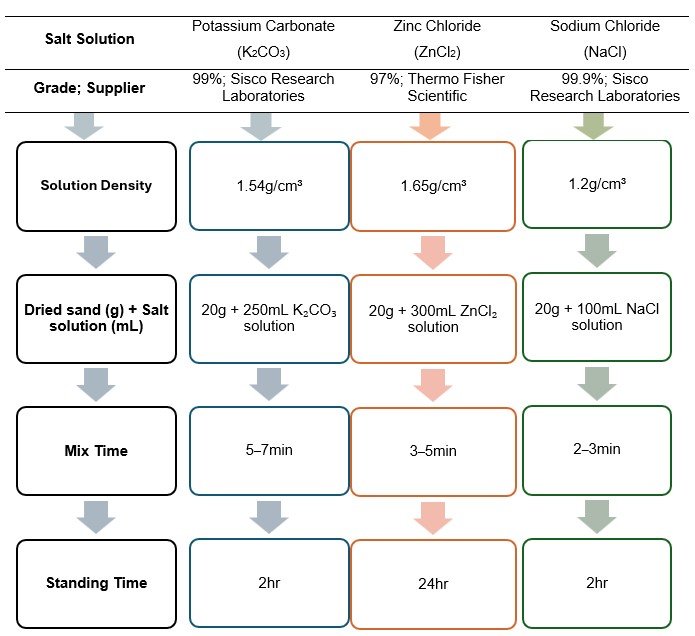 Figure 2. Density Separation Method for Microplastic Isolation Using Different Salt Solutions
Sediment Characteristics
Sand samples from each location were also processed and analysed for grain size distribution, sorting, and skewness to characterise the sediment properties of each beach and assess their potential influence on microplastic isolation using different solutions. Approximately 200g of sediment from each study site was oven dried at 60°C and weighed at 24-hour intervals until the difference between consecutive weights was <0.1%, after which the sand was considered completely dry.
The dried sand was then sieved manually for 15–20min using stacked Endecott metal sieves (200mm diameter) with mesh sizes of 4mm, 2mm, 1mm, 0.5mm, 0.25mm, 0.125mm, and 0.063mm, following standard procedures (Carson et al., 2011; Blott & Pye, 2012). After sieving, the sand retained in each sieve was transferred into separate glass containers. Residual sand grains adhering to the sieves were carefully removed using a sieve brush and by gently tapping the underside of the sieves into the appropriate containers. Each sand fraction was subsequently weighed separately. Sand fractions were then classified into size fractions according to the Wentworth grain size scale (Carson et al., 2011; Blott & Pye, 2012).
The percentage weight retained in each sieve fraction was used to calculate mean grain size and other sediment characteristics. Mean grain size, sorting, and skewness, were determined using the graphical method proposed by Folk & Ward (1957), based on phi (φ) values, where grain size is expressed on a logarithmic scale (φ = —log2 d), with d representing grain diameter in millimetres. Percentile values including φ5, φ16, φ25, φ50, φ75, φ84, and φ95 were obtained from the grain size data and used to calculate these parameters. Mean grain size represents the average sediment particle size, sorting indicates the uniformity of sediment distribution, and skewness reflects the dominance of finer or coarser particles within the sediment sample.
Sorting was used to evaluate the uniformity of sediment grain sizes, where lower sorting values indicate more uniform sediments and higher values indicate greater variability in grain size distribution. Inclusive graphic standard deviation (sorting) was calculated using the following equation (Folk & Ward, 1957):
| σI = |
|
+ |
|
where φ84 and φ16 represent the 84th and 16th percentiles, respectively, and φ95 and φ5 represent the 95th and 5th percentiles. Lower sorting values indicate well sorted sediments with relatively uniform grain sizes, whereas higher values indicate poorly sorted sediments with greater variability in particle size distribution (Blott & Pye, 2001).
Skewness was calculated to determine whether sediments contained a greater proportion of finer or coarser particles relative to the average grain size. Inclusive graphic skewness was calculated using the following equation (Folk & Ward, 1957):
| SkI = |
|
+ |
|
where φ50 represents the median grain size. Positive skewness values indicate dominance of finer particles, negative skewness values indicate dominance of coarser particles, and values close to zero indicate symmetrical grain size distribution (Folk & Ward, 1957).
Results
Microplastic Isolation
The number of microplastics isolated at each location varied with separation solution. Isolation performed with K₂CO₃ resulted in the highest mean counts for all categories of microplastics at all locations. The lowest microplastic counts were recorded when microplastic isolation was done using ZnCl₂ (Table 1). However, a PERMANOVA found no significant variation (F=1.006, R²=0.60, p=0.455) among the total number of microplastics isolated from each study site using different salt solutions. Fibres were the dominant microplastic category isolated from all beaches irrespective of the salt solution used. Microplastic fragments, pellets, foam, films, and other forms were comparatively few (Table 1). Control filter papers and salt solutions, visually inspected for airborne contamination, revealed no microplastics.
Table 1: Microplastics (number ± standard deviation (range) in a 20g sample) isolated from surface beach sand at four study sites using K₂CO₃, NaCl, and ZnCl₂ solutions.
| Microplastic Category | ||||||||
| Solution | Study Site | Fibre | Pellet | Fragment | Foam | Film | Other | Total |
| Velas | 60.0±2.0
(58-62) |
0.0 | 0.0 | 0.0 | 0.0 | 0.0 | 60.0±2.0
(58-62) |
|
| Wayangani | 38.7±9.1
(32-49) |
0.0 | 0.0 | 0.0 | 0.0 | 0.3±0.6
(0-1) |
39.0±8.7
(33-49) |
|
| Morjim | 53.7±11.6
(43-66) |
0.0 | 1.0±1.0
(0-2) |
0.0 | 0.0 | 0.0 | 54.7±11.0
(44-66) |
|
| Agonda | 51.7±9.5 (41-59) | 0.0 | 2.3±2.1
(3-4) |
0.0 | 0.0 | 0.7±1.2
(0-2) |
54.7±10.5
(44-65) |
|
| NaCl | Velas | 40.0±11.5
(27-49) |
0.0 | 1.3±0.6
(1-2) |
0.0 | 0.0 | 0.0 | 41.3±11.0
(29-50) |
| Wayangani | 34.3±10.8
(22-42) |
0.0 | 0.7±0.6
(0-1) |
0.0 | 0.0 | 0.3±0.6
(0-1) |
35.3±11.0
(23-44) |
|
| Morjim | 37.7±4.7
(34-43) |
0.0 | 0.3±0.6
(0-1) |
0.0 | 0.0 | 0.0 | 38.0±4.4
(35-43) |
|
| Agonda | 42.3±11.0
(31-53) |
0.0 | 1.7±0.6
(1-2) |
0.0 | 0.0 | 0.0 | 44.0±11.5
(32-55) |
|
| ZnCl2 | Velas | 30.0±2.6
(28-33) |
0.0 | 1.0±1.0
(0-2) |
0.0 | 0.0 | 0.0 | 31.0±3.6
(28-35) |
| Wayangani | 25.7±5.8
(19-29) |
0.3±0.6
(0-1) |
0.3±0.6
(0-1) |
0.0 | 0.0 | 0.0 | 26.3±6.9
(20-30) |
|
| Morjim | 19.0±2.6
(16-21) |
0.0 | 0.0 | 0.0 | 0.0 | 0.0 | 24.7±7.5
(17-32) |
|
| Agonda | 24.0±7.5
(17-32) |
0.0 | 0.7±1.2
(0-2) |
0.0 | 0.0 | 0.0 | 19.0±2.6
(16-21) |
|
Sediment Characteristics
Sediment characteristics differed among the four study sites. Using the Wentworth grain size classification, sediments from Velas and Morjim predominantly consisted of very fine sand fractions, whereas Wayangani and Agonda were dominated by fine sand. Velas beach sediment exhibited the lowest sorting value (0.45), indicating well-sorted sediment with relatively uniform grain sizes. In comparison, sediments from Wayangani, Morjim, and Agonda were classified as moderately well sorted, with sorting values ranging from 0.56 to 0.66, suggesting greater variability in grain size distribution. Skewness values also varied among study sites, reflecting differences in sediment particle distribution. Velas (-1.1) and Morjim (-1.66) exhibited strongly negative skewness, indicating a higher proportion of coarser particles relative to the mean grain size. Wayangani (-0.16) showed near-symmetrical distribution, whereas Agonda (0.40) displayed positive skewness, suggesting a relatively greater proportion of finer sediment particles (Table 2).
Table 2: Characteristics of beach sediments
| Study Site | Mean Grain Size (φ) | Wentworth Classification | Sorting Value | Sorting Category | Skewness |
| Velas | 3.73 | Very fine | 0.45 | Well sorted | -1.21 |
| Wayangani | 2.07 | Fine | 0.57 | Moderately well sorted | -0.16 |
| Morjim | 3.69 | Very fine | 0.56 | Moderately well sorted | -1.66 |
| Agonda | 2.28 | Fine | 0.66 | Moderately well sorted | 0.40 |
DISCUSSION
This study compared the efficiency of three commonly used density separation salt solutions (NaCl, K₂CO₃, and ZnCl₂) for isolating microplastics from sand collected from four sea turtle nesting beaches along the coasts of Maharashtra and Goa, India. A PERMANOVA revealed no statistical difference in microplastic isolation efficiency among the salt solutions across locations (p=0.455), despite differences in sand characteristics (grain size and classification, sorting value and category, and skewness).
Among the tested salt solutions, K₂CO₃ consistently isolated higher mean microplastic counts across all sampling sites and across most microplastic categories, particularly fibres and fragments. The comparatively higher isolation efficiency of K₂CO₃ may be attributed to its density (1.54g/cm³). Previous studies have similarly identified K₂CO₃ as an effective and environmentally safer alternative for microplastic isolation when compared with other salts such as ZnCl₂ and NaI (Patti et al., 2020; Gohla et al., 2021). K₂CO₃ solution also exhibits lower viscosity and reduced particle aggregation during separation, which improves sediment settling, facilitates decanting and vacuum filtration, and enhances overall microplastic isolation efficiency. Its ability to recover a broader range of polymer types while maintaining operational simplicity makes it particularly suitable for microplastic research (Coppock et al., 2017; Rani et al., 2020; Gohla et al., 2021).
NaCl isolated intermediate numbers of microplastics across all beaches in this study. NaCl is widely used in microplastic studies because it is inexpensive, easily available, and non-toxic (Thompson et al., 2004; Claessens et al., 2011). However, the relatively low density of NaCl solution limits the isolation of heavier polymers such as polyethylene terephthalate (PET) and polyvinyl chloride (PVC), which may remain within the sediment fraction during separation (Claessens et al., 2013; Coppock et al., 2017). Consequently, NaCl-based isolation methods may underestimate the total abundance of microplastics in beach sand, particularly where dense polymers are present (Imhof et al., 2012; Prata et al., 2019).
ZnCl₂ isolated the lowest number of microplastics in this study despite its high density (1.6g/cm³), which is generally considered suitable for isolating dense plastic polymers (Imhof et al., 2012). The lower isolation observed in this study may be associated with interactions between the dense solution and sediment grain size characteristics. Fine-grained sediments, particularly very fine sand and silt fractions, tend to remain suspended for longer periods in ZnCl₂ solutions, resulting in increased turbidity and aggregation of sediment particles (Claessens et al., 2013; Coppock et al., 2017). These aggregates can entrap microplastics and reduce flotation efficiency during separation and filtration. Since beach sediment from this study sites were dominated by very fine to fine sand fractions (Carson et al., 2011; Turra et al., 2014), sediment texture may have contributed to the comparatively lower recovery at these locations observed with ZnCl₂. Therefore, the reduced microplastic counts observed with ZnCl₂ in this study may reflect limitations associated with sediment texture.
Despite differences in sediment characteristics among the study beaches, the isolation efficiency pattern of the salt solutions remained consistent across locations. K₂CO₃ consistently isolated the largest number of microplastics across all beaches and microplastic categories, while also providing advantages in terms of high density, operational simplicity, and cost-effectiveness. Therefore, K₂CO₃ was determined to be the most suitable salt solution for the locations and will be used for the isolation and analysis of microplastics from all remaining sediment samples in the current study.
CONCLUSION
This study compared effectiveness of three salt solutions K₂CO₃, NaCl, and ZnCl₂ for isolating microplastics from beach sediments collected from sea turtle nesting beaches along the coasts for Maharashtra and Goa, India. Although no significant differences were detected among the number of microplastics isolated by each salt solution, K₂CO₃ consistently recovered higher numbers of microplastics compared with NaCl and ZnCl₂. NaCl showed moderate recovery efficiency whereas ZnCl2 isolated the fewest microplastics, possibly due to interactions between dense salt solution and fine sediment fractions that reduce separation efficiency. Considering its comparatively high isolation efficiency, cost effectiveness, environmental safety, and ease of handling, K₂CO₃ will be used to isolate microplastics during more detailed examination of temporal and spatial variation in beach microplastics at the four study sites in future research.
Literature cited:
Andrady, A.L. 2011. Microplastics in the marine environment. Marine Pollution Bulletin 62: 1596-1605.
Balasubramaniam, M. & A.D. Phillott. 2016. Preliminary observations of microplastics from beaches in the Indian ocean. Indian Ocean Turtle Newsletter 23: 13-16.
Beckingham, B., A. Apintiloaiei, C. Moore & J. Brandes. 2023. Hot or not: Systematic review and laboratory evaluation of the hot needle test for microplastic identification. Microplastics and Nanoplastics 3: 8. DOI: 10.1186/s43591-023-00056-4.
Blott, S.J. & K. Pye. 2001. GRADISTAT: A grain size distribution and statistics package for the analysis of unconsolidated sediments. Earth Surface Processes and Landforms 26: 1237-1248.
Blott, S.J. & K. Pye. 2012. Particle size scales and classification of sediment types based on particle size distributions: Review and recommended procedures. Sedimentology 59: 2071-2096.
Browne, M.A., P. Crump, S.J. Niven, E. Teuten, A. Tonkin, T. Galloway & R. Thompson. 2011. Accumulation of microplastic on shorelines worldwide: sources and sinks. Environmental Science and Pollution Research 45: 9175-9179.
Campos-M, M. & R. Campos-C. 2017. Applications of quartering method in soils and foods. International Journal of Engineering Research and Application 7: 35-39.
Carson, H.S., S.L. Colbert, M.J. Kaylor & K.J. McDermid. 2011. Small plastic debris changes water movement and heat transfer through beach sediments. Marine Pollution Bulletin 62: 1708-1713.
Claessens, M., S. De Meester, L. Van Landuyt, K. De Clerck & C.R. Janssen. 2011. Occurrence and distribution of microplastics in marine sediments along the Belgian coast. Marine Pollution Bulletin 62: 2199-2204.
Claessens, M., L. Van Cauwenberghe, M.B. Vandegehuchte & C.R. Janssen. 2013. New techniques for the detection of microplastics in sediments and field collected organisms. Marine Pollution Bulletin 70: 227-233.
Cole, M., P. Lindeque, C. Halsband & T.S. Galloway. 2011. Microplastics as contaminants in the marine environment: a review. Marine Pollution Bulletin 62: 2588-2597.
Coppock, R.L., M. Cole, P.K. Lindeque, A.M. Queirós & T.S. Galloway. 2017. A small-scale, portable method for extracting microplastics from marine sediments. Environmental Pollution 230: 829-837.
Dijkstra, H., P. Van Beukering & R. Brouwer. 2021. In the business of dirty oceans: overview of startups and entrepreneurs managing marine plastic. Marine Pollution Bulletin 162: 111880. DOI: 10.1016/j.marpolbul.2020.111880.
Duncan, E.M., A.C. Broderick, W.J. Fuller, T.S. Galloway, M.H. Godfrey, M. Hamann, C.J. Limpus et al. 2019. Microplastic ingestion ubiquitous in marine turtles. Global Change Biology 25: 744-752.
Estrella-Jordan, B.A., F. Lango-Reynoso, M.R. Castañeda-Chávez, J. Montoya-Mendoza & D. Reynier-Valdes. 2023. Microplastic pollution in sea turtle nests on the beaches of Nautla and Vega de Alatorre, Veracruz. Microplastics 2: 182-191.
Fuentes, M.M.P.B., V. Beckwidth & M. Ware. 2023. The effects of microplastic on the thermal profile of sand: implications for marine turtle nesting grounds. Frontiers in Marine Science 10: 1146556. DOI: 10.3389/fmars.2023.1146556.
Folk, R.L. & W.C. Ward. 1957. Brazos River bar [Texas]; A study in the significance of grain size parameters. Journal of Sedimentary Research 27: 3-26.
Gohla, J., S. Bračun, G. Gretschel, S. Koblmüller, M. Wagner & C. Pacher. 2021. Potassium carbonate (K2CO3)–A cheap, non-toxic and high-density floating solution for microplastic isolation from beach sediments. Marine Pollution Bulletin 170: 112618. DOI: 10.1016/j.marpolbul.2021.112618.
Hays, G.C., A.D. Mazaris, G. Schofield & J.O. Laloë. 2017. Population viability at extreme sex-ratio skews produced by temperature-dependent sex determination. Proceedings of the Royal Society B: Biological Science 284: 20162576. DOI: 10.1098/rspb.2016.2576.
Hays, G.C., W.J. Chivers, J.O. Laloë, C. Sheppard & N. Esteban. 2021. Impact of marine heatwaves for sea turtle nest temperatures. Biology Letters 17: 20210038. DOI: 10.1098/rsbl.2021.0038.
Hidalgo-Ruz, V., L. Gutow, R.C. Thompson & M. Thiel. 2012. Microplastics in the marine environment: A review of the methods used for identification and quantification. Environmental Science and Technology 46: 3060-3075.
Imhof, H.K., J. Schmid, R. Niessner, N.P. Ivleva & C. Laforsch. 2012. A novel, highly efficient method for the separation and quantification of plastic particles in sediments of aquatic environments. Limnology and Oceanography: Methods 10: 524-537.
Karami, A., A. Golieskardi, C.K. Choo, N. Romano, Y.B. Ho & B. Salamatinia. 2017. A high-performance protocol for extraction of microplastics in fish. Science of the Total Environment 578: 485-494.
Kumar, R., A. Verma, A. Shome, R. Sinha, P.K. Jha, R. Kumar, P. Kumar, et al. 2021. Impacts of plastic pollution on ecosystem services, sustainable development goals, and need to focus on circular economy and policy interventions. Sustainability 13: 9963. DOI: 10.3390/su13179963.
Laloë, J.O., G. Schofield & G.C. Hays. 2024. Climate warming and sea turtle sex ratios across the globe. Global Change Biology 30: 123-137.
Laloë, J.O., J. Cozens, B. Renom, A. Taxonera & G.C. Hays. 2017. Climate change and temperature-linked hatchling mortality at a globally important sea turtle nesting site. Global Change Biology 23: 4922-4931.
Masura, J., J.E. Baker, G.D. Foster, C. Arthur & C. Herring. 2015. Laboratory methods for the analysis of microplastics in the marine environment: Recommendations for quantifying synthetic particles in waters and sediments. NOAA Technical Memorandum NOS-OR&R-48.
Miller, M.E., F.J. Kroon & C.A. Motti. 2017. Recovering microplastics from marine samples: A review of current practices. Marine Pollution Bulletin 123: 6-18.
Mollet Saint Benoit, C. 2019. Examining the density and distribution of micro and macroplastics as a possible contributor to sea turtle nesting sand habitat quality. Master’s Thesis. Georgia State University, Atlanta, USA.
Monteiro, R.C.P., J.A.I.D. Sul & M. F. Costa. 2020. Small microplastics on beaches of Fernando de Noronha Island, tropical Atlantic Ocean. Ocean and Coastal Research 68: e20235. DOI: 10.1590/S2675-28242020068235.
Nuelle, M.T., J.H. Dekiff, D. Remy & E. Fries. 2014. A new analytical approach for monitoring microplastics in marine sediments. Environmental Pollution 184: 161-169.
Patti, T.B., E.K. Fobert, S.E. Reeves & K.B. da Silva. 2020. Spatial distribution of microplastics around an inhabited coral island in the Maldives, Indian Ocean. Science of the Total Environment 748: 141263. DOI: 10.1016/j.scitotenv.2020.141263.
Prata, J.C., J.P. Da Costa, A.C. Duarte & T. Rocha-Santos. 2019. Methods for sampling and detection of microplastics in water and sediment: A critical review. Trends in Analytical Chemistry 110: 150-159.
Quinn, B., Murphy, F., & C. Ewins. 2017. Validation of density separation for the rapid recovery of microplastics from sediment. Analytical Methods 9: 1491-1498.
Santidrián Tomillo, P., V.S. Saba, G.S. Blanco, C.A. Stock, F.V. Paladino & J.R. Spotila. 2012. Climate driven egg and hatchling mortality threatens survival of eastern Pacific leatherback turtles. PLoS ONE 7: e37602. DOI: 10.1371/journal.pone.0037602.
Savoca, D., M. Arculeo, S. Barreca, S. Buscemi, S. Caracappa, A. Gentile, M. Flaminia Perschetti, et al. 2018. Chasing phthalates in tissues of marine turtles from the Mediterranean Sea. Marine Pollution Bulletin 127: 165-169.
Schütze, B., D. Thomas, M. Kraft, J. Brunotte & R. Kreuzig. 2022. Comparison of different salt solutions for density separation of conventional and biodegradable microplastic from solid sample matrices. Environmental Science and Pollution Research 29: 81452-81467.
Thompson, R.C., Y. Olsen, R.P. Mitchell, A. Davis, S.J. Rowland, A.W. John, D. McGonigle et al. 2004. Lost at sea: Where is all the plastic? Science 304: 838-838.
Turra, A., A.B. Manzano, R.J.S. Dias, M.M. Mahiques, L. Barbosa, D. Balthazar-Silva & F.T. Moreira. 2014. Three-dimensional distribution of plastic pellets in sandy beaches: Shifting paradigms. Scientific Reports 4: 4435. DOI: 10.1038/srep04435.
Wentworth, C.K. 1922. A scale of grade and class terms for clastic sediments. The Journal of Geology 30: 377-392.
Willis, K., B.D. Hardesty, J. Vince & C. Wilcox. 2022. Local waste management successfully reduces coastal plastic pollution. One Earth 5: 666-676.
Wright, S.L., R.C. Thompson & T.S. Galloway. 2013. The physical impacts of microplastics on marine organisms: A review. Environmental Pollution 178: 483-492.
Zhang, Y., Y. Jiao, Z. Li, Y. Tao & Y. Yang. 2021. Hazards of phthalates (PAEs) exposure: a review of aquatic animal toxicology studies. Science of the Total Environment 771: 145418. DOI: 10.1016/j.scitotenv.2021.145418.
Zhang, L., Y. He, L. Jiang, Y Shi, L. Hao, L. Huang, M. Lyu, et al. 2024. Plastic additives as a new threat to the global environment: research status, remediation strategies and perspectives. Environmental Research 263: 120007. DOI: 10.1016/j.envres.2024.120007.